
Fundamental analysis is the process of assessing the intrinsic value of a security. This method tells whether the security is overvalued or undervalued by considering a few factors. These factors may be microeconomic like a company’s financial stability, management skills, etc. or macroeconomic like state of the economy, market performance, political scenario, etc.
Traders use fundamental analysis to conduct a feasibility test on a company before investing in it. Knowing – what is fundamental trading – is essential for those who are looking to buy and sell stocks for the first time.
Fundamental analysis is the process of examining a company’s financial statements to help decide if its stock is a good investment. Financial statements consists balance sheets, income statements, and cash flow statements. This information helps determine the financial makeup of the company behind the stock.
How fundamental analysis uses these statements to help evaluate a company.

Let’s start with a balance sheet.
The Balance Sheet compares the company’s current assets to its liabilities and owner’s equity.
Let’s define these terms. First, we have assets, which are items the company owns. Assets are usually comprised of cash, equipment, and property. Next are liabilities. Liabilities are usually debts or accounts that need to be paid. Often, a liability on the balance sheet has an offsetting asset that helps the numbers stay level.
For example, if a company were to take a loan out to buy a property, the loan would be a liability, and the property would be an asset. The third term of a balance sheet is capital or owner’s equity, which is the amount of assets raised by issuing stock.
For example, when a company issues stock either in its initial public offering or in a secondary offering, it raises money or capital that can be used to fund various business expenses. Balance is achieved when the value of the assets is equal to liabilities and owner’s equity.
The balance sheet helps you see how a company raises money for its assets and can help you determine if the company is overextended. However, if you want to know how the company earns money, you’d look at its income statement. An income statement shows a company’s revenues and expenses.
These are the costs associated with running the business, including operations, interest paid on loans, and taxes. When you take revenues and subtract expenses, you get net income. Net income is the earnings of a company. Earnings are usually handled in two ways.
The first way is to share the earnings with shareholders by paying a dividend. The second way is to reinvest these earnings into the company. Reinvesting earnings can help a company’s cash position.
A company with a good cash position is usually better prepared to endure economic ups and downs. This is why some investors say cash is king.

It’s also why the cash flow statement is an important item to consider. This statement shows how the company uses its cash to operate the business and make investments. It also shows how much is borrowed from a bank or a bondholder. These figures are totalled to show changes in the company’s overall cash position. This statement is important because it gives a more detailed account of how the business generates revenue, and is therefore much more difficult to manipulate than an income statement.
As you can see, there is a lot of information in the three financial statements. With all of these facts and figures, analysis can be a little tricky. This is why some investors may use ratios. There are several ratios that can help an investor compare stocks, but we’ll focus on one of the most common, the price to earnings or P/E ratio.
How would you know which one is the best value?
Let’s say you have one stock that’s trading at a $6 share, another at $35 a share, and a third at $132 a share. Some might assume the $6 stock is the best value, because it’s the cheapest. However, this might not be the case, because a company’s value may depend largely on the company’s earnings.
The P/E ratio allows you to look beyond the price of a stock to see which company could be the best value. To create this ratio, first divide the net income or earnings by the number of outstanding shares. This number is called Earnings Per Share or EPS.
Next, divide the price of the stock by the EPS to get the P/E ratio.
The first company is trading at $6 and has an EPS of $0.20, resulting in a P/E of 30.
The second company is trading at $35 a share and has an EPA of $1.40 for a P/E of 25.
The final company is trading at $132 per share and has an EPA of $3.90 for a P/E of 34.
Now, you can better compare each company by its P/E ratio. Despite the drastic difference in stock prices, all three companies have a similar valuation. However, the second company has the lowest P/E ratio and may be the best value. Remember, a P/E ratio is only one of several ratios that can be used. There are other ratios for determining valuation, profitability, and financial strength. There are also other figures to examine in financial statements. We’ve only scratched the surface of fundamental analysis till now.
The term “technical analysis” might sound a little, well, technical, but it’s actually pretty simple.

Essentially, it’s a strategy an investor may use to examine an investments chart and attempt to forecast its future performance. Some investors may use technical analysis to attempt to identify when to enter or exit a stock position. When performing technical analysis, investors can use a variety of techniques and tools to analyse a chart.
Let us focus on a few technical analysis basics including trend, support and resistance, price patterns, and technical indicators.
Let’s start with the first technique, trend.
Trend is the general direction a stock’s price is moving.
There are three kinds of trends–
up, which is a series of higher highs and higher lows; down, which is a series of lower highs and lower lows; and sideways, which has roughly equal highs and lows.
Some investors determine a stock’s trend by identifying the direction of its highs and lows. Trend could also be important because many investors believe that a stock will generally continue within the same direction
it’s been going. These investors would anticipate a stock with a robust uptrend to still rise, while one with a robust downtrend will still fall.
Some investors draw lines to aim to spot the trend. Investors also can draw lines to attach highs and lows. These lines are referred to as support and resistance levels, subsequent technique we’ll discuss. Support and resistance are price levels that the stock was having trouble in breaking through. If a stock breaks through support or resistance, it might be a sign to enter or exit.
For example, suppose a stock breaks through resistance, which is that the level it repeatedly pulled back from within the past.
Because it broke through resistance, an investor may believe that there is an honest chance that the stock will still rise. So broken resistance could also be an honest time to enter. On the opposite hand, if the stock fell past a support area, it’s going to still fall. this might be considered an honest time to exit.
After connecting support and resistance levels, a stock’s price movement may resemble a particular shape. These shapes are called price patterns and are another technical analysis technique. Price patterns can repose on support and resistance, allowing investors to aim to predict more specific movements and check out to means even more precise entry and exit signals.
There are many various price patterns. Some examples include simple shapes like triangles or flags
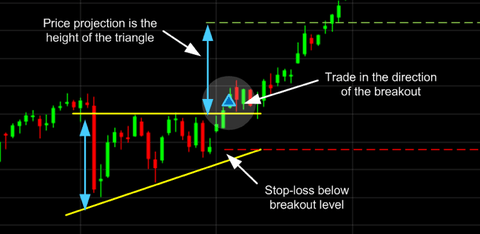
and more complex patterns like head and shoulders or triple tops. Let’s check out an example. this is often called an ascending triangle, and it forms when a stock’s highs are hitting resistance while its lows are steadily rising.
Some investors might interpret the narrowing between the highs and lows as a sign that the stock’s about to break through resistance. If it does, the stock’s price is predicted to rise in value right after the breakout, but not all investors exclusively use support and resistance and price patterns.
Drawing lines and finding shapes are often subjective. due to this, some investors may use technical indicators. Technical indicators are graphical representations of chart data.
![Technical Analysis [ChartSchool]](https://school.stockcharts.com/lib/exe/fetch.php?media=overview:technical_analysis:ta1-ibm-trendingtrading.png)
A common technical indicator may be a moving average line. This indicator averages the stock’s price
over a period of your time and plots it as a line, which may help determine the general trend. Moving averages are often calculated for any period of your time , but one among the foremost common is 50 days.
What does a moving average say about an investment?
Imagine a stock’s price crosses above its 50-day moving average. this might indicate that the stock is outperforming its recent history. this might be an entry signal. Similarly, if the stock begins to fall and dips below its moving average, it might be an exit signal. Moving average lines are just one of the many technical indicators investors may use.
Other common indicators include price envelopes, Ballinger bands, stochastic oscillators, and therefore the relative strength index. At now , we’ve covered some basics of technical analysis. One thing to stay in mind is that technical analysis can assist you identify potential entry and exit signals, but it offers no guarantee of success. After all, there’s no thanks to predict the longer term . We’ve only covered the tip of the technical analysis iceberg.
Learning how to use the techniques and tools we’ve discussed, as well as the many others out there, can advance your technical analysis skills.
Have you ever found yourself looking at nutrition labels at the grocery store?
Maybe you were looking for something specific like sugar levels or certain vitamins and minerals. Well, financial statements are similar. They show you where a company’s money came from, where it went, and where it is currently. Virtually every fundamental analysis strategy involves analysing data from financial statements, so being familiar with these statements is important.

Every publicly traded company in the U.S. has to produce three main financial statements each quarter: income statement, balance sheet, and cash flow statement. Let’s look at each in a little more detail. The income statement might look the most familiar to you. It’s basically a line-by-line summary of how much a company earned over a period of time.
It begins with a “top-line” report of the company’s revenue from selling goods and services. Then, as you move down the report, it subtracts all the costs associated with running the business. These costs include operating expenses, like raw materials and wages, interest expense, which is how much the company pays in interest for borrowed money, and asset depreciation.
After subtracting all the expenses, the income statement reports the “bottom-line” earnings. This is how much the company actually earned or lost during a period. As a shareholder, earnings is one of the most important figures to know.
Another financial statement is the balance sheet, a ledger-like statement of a company’s Assets, liabilities, and shareholders’ equity. Assets are things the company owns that have value, or have an economic benefit. Assets include tangible items like property, factories, equipment, and inventory. They also include intangible things like patents and trademarks. Cash and investments are assets too.
If you look at the other side of the balance sheet, you’ll see liabilities and equity. Liabilities are money a company owes to others, but it also includes rent for buildings, money owed to vendors, or taxes due.
If you subtract liabilities from assets, you’re left with shareholders’ equity. Often called “book value”, it’s the amount of money that would be left to shareholders if the company shut down and sold its assets and paid all its liabilities. All of these items must “balance” to provide an accurate picture of a company’s financial state.
Finally, there’s the cash flow statement. It details the company’s inflows and outflows of cash, and the relationships between the income statement and balance sheet. While the other statements can contain accounting assumptions that affect the numbers, the cash flow statement is considered a clean report with very little room to manipulate. You can’t fake cash, so it can be useful to examine this document to learn how a company makes money.
 It’s worth pointing out that there are other important sources of a company’s financial picture, like footnotes and management reports. With this information you can compare similar companies to find the stocks with the best potential value.
Fundamental analysis is the process we use to evaluate the economic health and financial performance of the underlying company. Each quarter publicly traded companies issue reports that include accounting metrics such as sales debt and other information that will help us gauge how well that company is doing financially.
There are thousands of companies from which to select. Investors often use fundamental analysis as a way to filter through these companies to narrow down the list fundamental analysis helps us decide which companies to buy. Unlike technical analysis which helps us decide when to buy and when to sell the stocks.
An important point to using fundamental analysis is the delay associated with the metrics provided to the public.
You see these reports are going to come out on weekly monthly even quarterly basis and so from the time of the performance to the time the performance is reported. There’s going to be a delay unlike technical analysis where the charts are going to update in real time. Each time there’s a trade you get new information and we take these reports and use them to find the companies that are separating themselves from the rest.

In other words, the fundamental metrics can help investors identify companies that are ledgers versus ledgers in their sector. Now you don’t have to just use fundamental analysis on an individual company you can also look at a sector or an industry. In fact, you can use fundamental analysis to evaluate the broader markets keeping your finger on the pulse of what’s going on in the economy.
Here’s an example we have a stock that is trading at $20 per share with earnings of $1. Our P/E ratio is 20. Now if the earnings per share increases to $2 and the price stays at $20 the stock, then P/E of 10. PE ratios can be a good way to do a side-by-side evaluation with regard to earnings.
Warren Buffett came up with an economy mode in this fundamental financial analysis of investing in stocks. So for example Coca-Cola. They have a strong economy mode. They sell soda i.e. They sell Cola and many argue it is not good for health. But if you want to challenge against them, it can be pretty damn difficult right because they have the brand. They have the reputation. They’ve been in business for a long time. So they have a strong economy.
This is an aspect of qualitative analysis. You can’t really quantify what this economic mode is. It is their branding. Their trust. They have been in business for a long time and the recipe is pretty much kept somewhere secret. So that is an economic mode and that’s another way of looking at qualitative analysis.
This tells you that there’s a good chance that the fundamentals in the company is pretty good even. So earnings and income is what many stock traders pay attention to. They pay attention to how the earnings have increased quarter and quarter. Or how the earnings have increased year-on-year. Both earnings and net income. So this for you- a stock trader this is something that you want to in the fundamental analysis for investment.