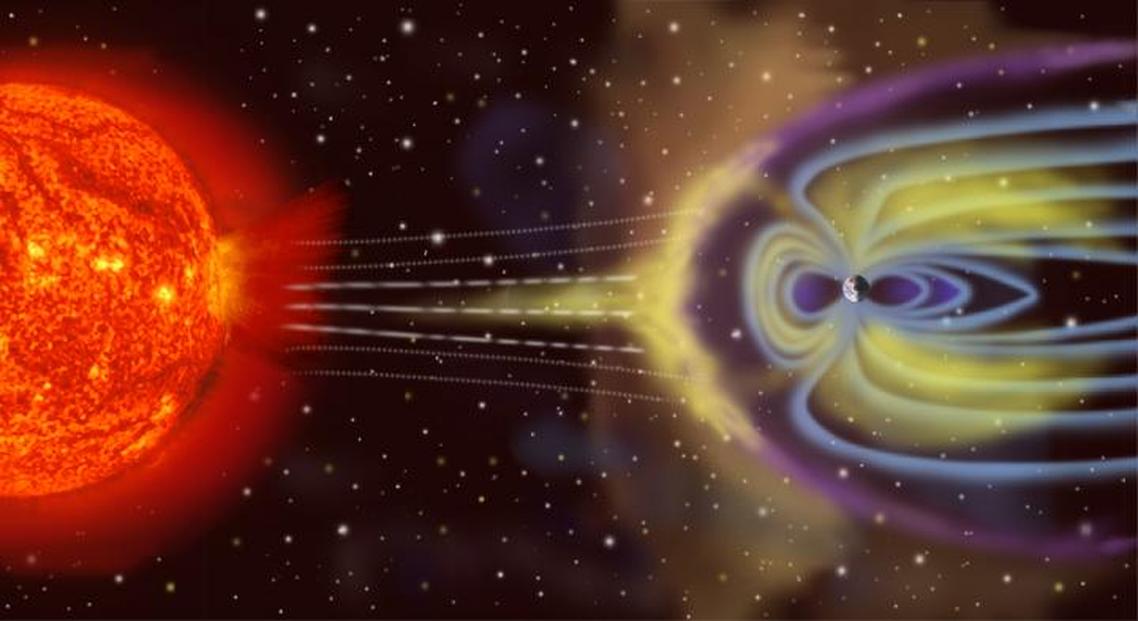
The magnetic field of the Earth extends from pole to pole and is strongly affected by solar winds. This “solar wind” is actually a stream of charged particles that are constantly ejected from the sun’s surface. Occasional, sudden flashes of brightness from the sun’s atmosphere, known as solar flares, release even more particles into the wind. Sometimes, these flares are followed by coronal mass ejections that send plasma into space.
The resulting flux of charged particles then travels millions and millions of miles from the sun to the Earth. When they reach the Earth, the particles also have an impact on the Earth’s magnetic field- which usually results in auroras and geomagnetic storms. While the auroras are breathtaking, the storms aren’t- they interfere with a number of important technologies like GPS signaling and satellite communications. They can also damage surface electrical grids. Solar activity is usually random and therefore it is quite difficult to predict these storms.
Published recently in the the journal Chaos, a group of researchers from Europe, led by Reik Donner at Potsdam Institute for Climate Impact Research in Germany, reports a new method to analyze magnetic field data that might help in providing better short-term forecasting of geomagnetic storms. This new method is based on a technique developed for systems in a state which is far from equilibrium. Earth’s magnetic field fits this criteria because the field is driven far away from equilibrium by the solar wind. Systems that are far from the state of equilibrium often go through sudden, abrupt changes- such as the sudden transition from a quiescent state to a storm.
The investigators decided to use hourly values of the Disturbance storm-time, or the Dst-index. Dst values provide information on the average deviation of the horizontal component of the Earth’s magnetic field from its normal value. This deviation takes place when a large burst of charged particles arrives from the sun and weakens the field generated by the Earth. The Dst values can form a single stream of numbers known which is known as a time series. The time series data can then be redone in a 2D or 3D image by plotting one data point against another at a fixed amount of time into the future for forecasting.
The authors have created a diagram known as a recurrence plot from the reconstructed data. The authors used this data to examine a pair of geomagnetic storms that occurred in 2001 from large solar flares a couple of days prior to the storm.
They used a method which is known as recurrence quantification analysis to demonstrate that long diagonal lines in these recurrence plots indicate more predictable geomagnetic behavior. The method is especially well-suited to differentiate between different types of geomagnetic field fluctuations. The technique also lets researchers characterize these differences with an accuracy that has not been previously achieved.